As I have now accrued much more experience with CPPTRAJ and AMBER16 in general, I can now confidently explain more in-depth the hbond Action Command. While I still won’t be talking about every parameter of the hbond command (seeing as they’ve been explained for the most part in a previous blog post), I will be explaining a few of the other parameters that I did not mention in a previous blog post. As a review, the syntax is as follows:
hbond [<dsname>] [out <filename>] [<mask>] [angle <acut>] [dist <dcut>]
[donormask <dmask> [donorhmask <dhmask>]] [avgout <filename>]
[solvout <filename>] [series [uvseries <filename>]]
As I’ve already explained what some of these parameters do in a previous post, I will not explain what they do, rather, I will be explaining the parameters that you, the reader, have yet to see in this series of blog posts.
- [angle <acut>] refers to the angle cutoff for hydrogen bond formation, meaning whatever the angle is set to, any hydrogen bond that forms at an angle smaller than what was specified, will not be counted as an actual hydrogen bond (CPPTRAJ ignores it). If this is not specified, then the default angle is 135 degrees. One can disable the cutoff by specifying the angle as -1.
- [dist <dcut>] refers to the distance cutoff for hydrogen bond formation, meaning whatever the distance is set to, a hydrogen bond that forms with a bond length greater than the set distance will not be counted as an actual hydrogen bond (CPPTRAJ ignores it). If this is not specified, then the default distance is 3.0 Angstroms. One cannot disable this cutoff.
- [avgout <filename>] refers to the name of a file that will be outputted containing information about the average bond length, the average bond angle, and the number of hydrogen bonds that formed throughout the entire production run for residues in which hydrogen bond formation happened.
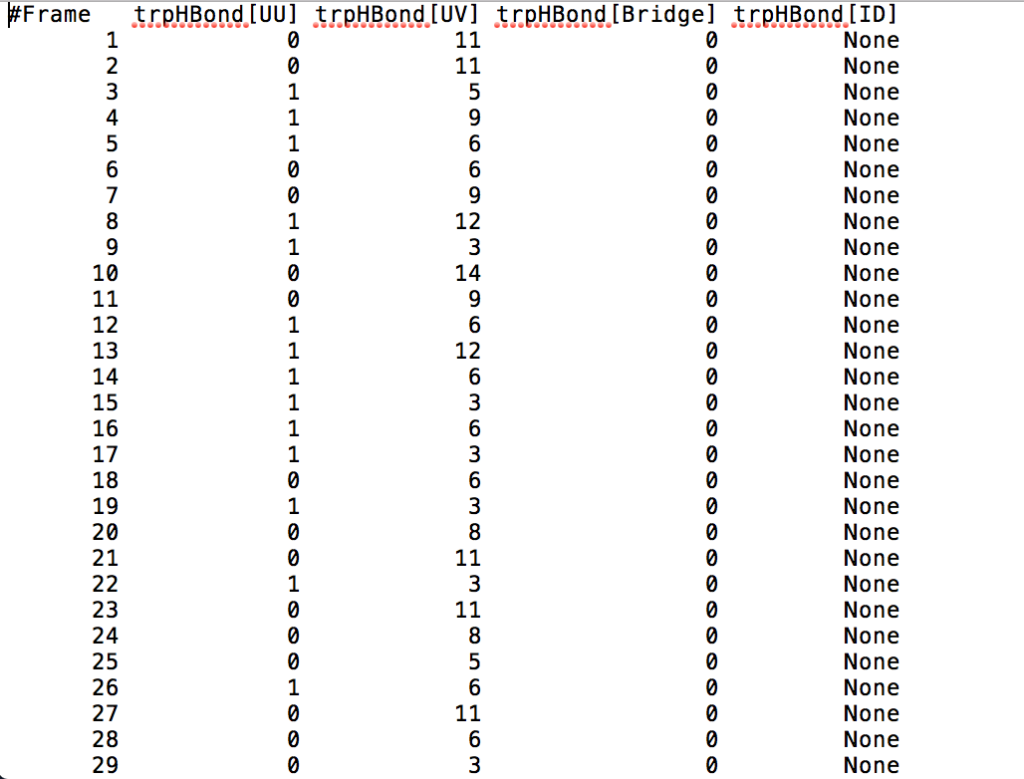
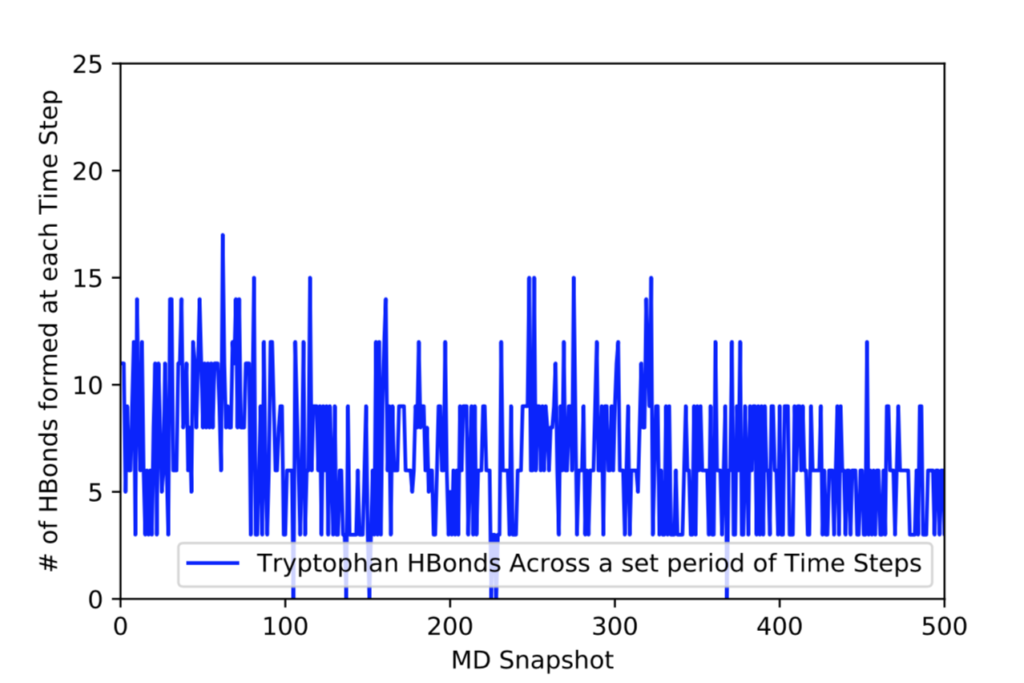
After learning about these parameters, I utilized them in my next production run, which yielded much more interesting results then the first time I used it. When I first used the hbond command, my results yielded nothing but 1’s and 0’s. That was because of the limiting default cutoffs. After disabling the angle cutoff and setting the distance cutoff to 3.5Å, my new data yielded much higher numbers. However, just because my data showed much better numbers, that doesn’t necessarily mean that many of those bonds can happen in real life. The reason those defaults are what they are is because those numbers are most likely the average lengths and angles in which hydrogen bonds actually form. Below are pictures of excerpts of the raw data, the average data, and a graph of the raw data of one of my production runs that utilized these new parameters. All of this data was obtained by doing a production run on the molecule, Melittin, and then by doing a trajectory run on the tryptophan of said Melittin. The exact syntax I used for the trajectory can be seen in the previous blog post (here is the link: http://williamkennerly.com/blog/a-mistake-with-the-hbond-action-command/)


Hi Will, this is nicely detailed useful blogpost about the hbond command – thanks!
I like the input template for the hbond command. It would be useful to see the specific hbond command that produced the output you showed.
Its hard to believe that at a single timestep (MD snapshot) a single Trp residue is hydrogen-bonding to 11 water molecules. Is that the right way to interpret this data?
Lastly a nitpick thing – you can use the symbol Å in a post, looks nicer than writing the name out.