The next three commands that I found to be helpful are known as Action Commands. Unlike the Topology Commands from the previous post, these Action Commands allow for a file to be created that contains the output. These commands can be used both in CPPTRAJ’s interactive mode, and in .ptraj files that can be called as inputs when starting CPPTRAJ.
distance [<name>] mask1 mask2 [out <filename>]
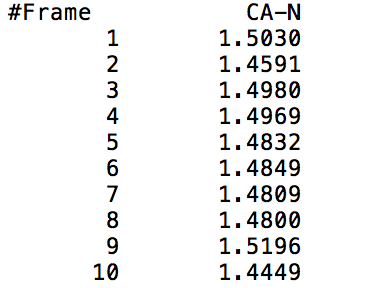
This command outputs a file that gives the distance from the center of mass of mask1 to the center of mass of mask2 at each time frame (mask1 and mask2 can either be residues or atoms). The output file will show two columns, one indicating the time frame number, and the other indicating the distance between the specified masks in Angstroms. The following visual shows a sample output of the command being called on the CA and N specified atoms (Carbon and Nitrogen respectively).
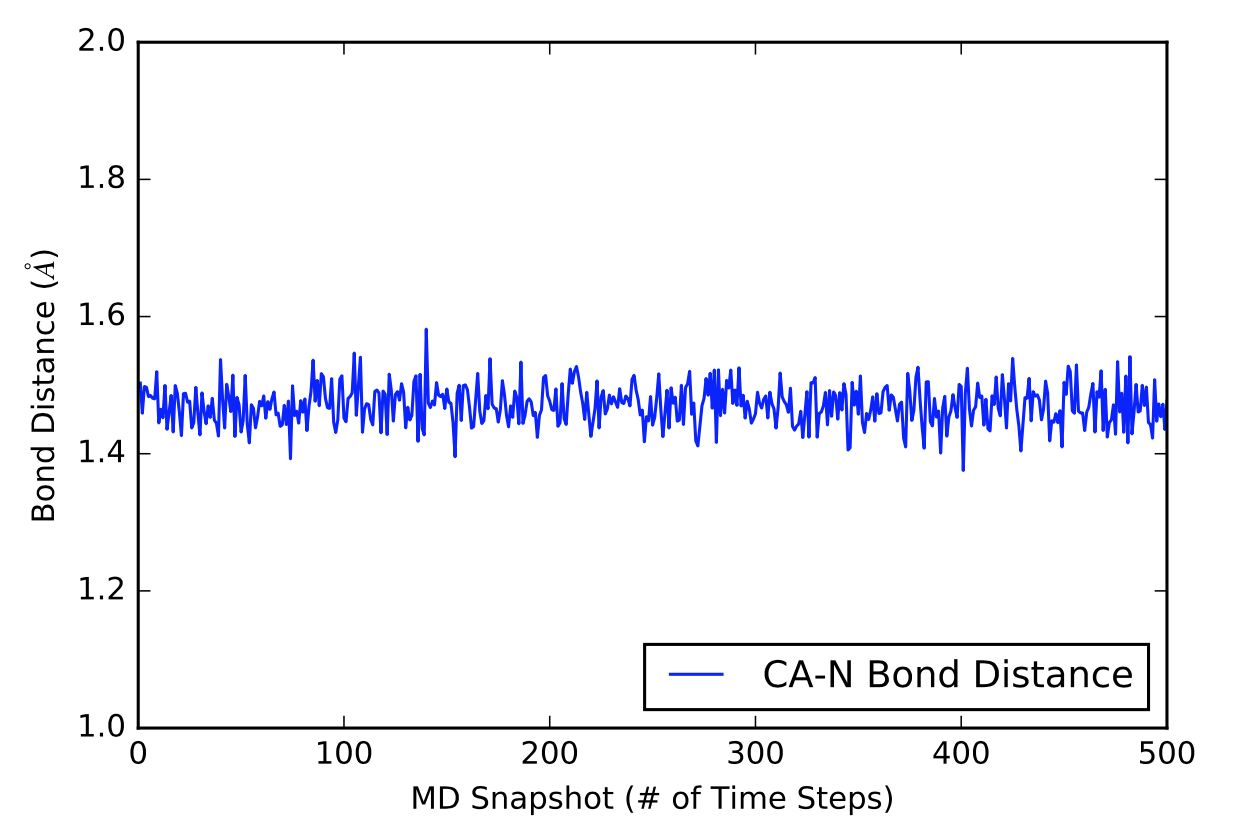
The next visual is a graph of the first 500 distance values in Angstroms in a 5000 time frame production run.
This action command can utilize other key modifiers to get slightly different outputs; however, the ones listed above are the main modifiers that are necessary to get decent data. When running CPPTRAJ on my production data on Melittin, the modifiers listed above were the only ones that I used.
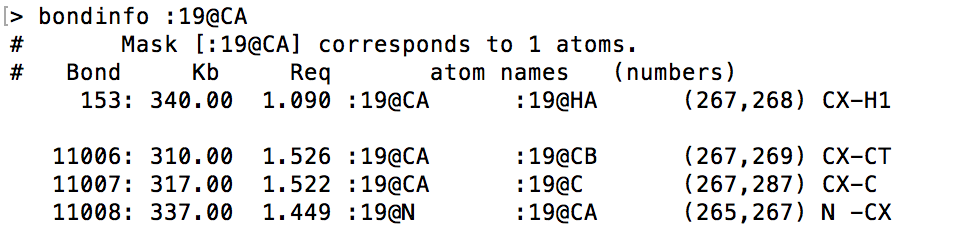
Example Usage: distance sample_name1 :19@CA :19@N out sample_data1.dat
hbond [<name>] [out <filename>] [<mask>] [donormask <dmask> [donorhmask <dhmask>]] [solvout <filename>] [series [uvseries <filename>]]
This action command outputs a file that shows where there was hydrogen bonding in the molecule (or specified residue or atom). Some of these modifiers are not intuitively obvious and have yet to be seen in previous action commands, so below is the list of the modifiers that we have yet to identify in this post above and what they do.
- [donormask <dmask> [donorhmask <dhmask]] refers to a specified residue or number of atoms that will be used as solute donor heavy atoms and a specified residue or number of atoms that will be used as solute donor hydrogen atoms respectively. The second mask should only be specified if the first mask is and the two masks should have a 1 to 1 correspondence between the two masks (in my case, one mask was specified as :WAT and the other was specified as :WAT@O, which represents the water box my Melittin was being simulated in).
- [solvout <filename>] refers to the name of a file that will be outputted containing the averaged information of the solute-solvent hydrogen bonds in the specified [<mask>]. The output file will show the average distances and average angles of the hydrogen bonds formed between the acceptor and donor atoms (both of which are shown in the output file), along with the number of times a hydrogen bond formed and the fraction of the total number of hydrogen bonds that were specified by the [<mask>].
- [series [uvseries <filename>]] refers to the name of a file that will be outputted containing the solute-solvent hydrogen bond time data in terms of whether a hydrogen bond was formed or not (as specified by a 1 meaning a hydrogen bond was formed, and a 0 meaning a hydrogen bond was not formed).
Normally, I would include sample data; however, the outputted data yielded very odd results that may or may not be completely useless, so I would much rather not give false data until I’m able to completely figure out how this command works. There are many other modifiers for this action command, but they turned out to be useless in my case.
Example Usage: hbond sample_name2 out sample_data2.dat solventdonor :WAT solventacceptor :WAT@O solvout sample_data3.dat series uvseries sample_data4.dat
rms/rmsd [<name>] <mask> [out <filename>]
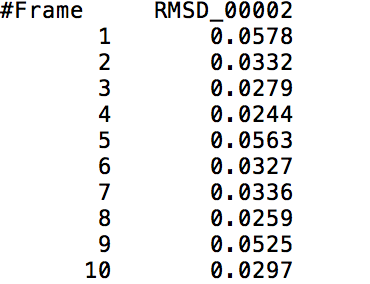
This action command outputs a file that contains the RMS Deviation values of a specified <mask> at each time frame. The following visual shows a small part of a sample output of the RMS Deviation values of the backbone of Tryptophan in Melittin.
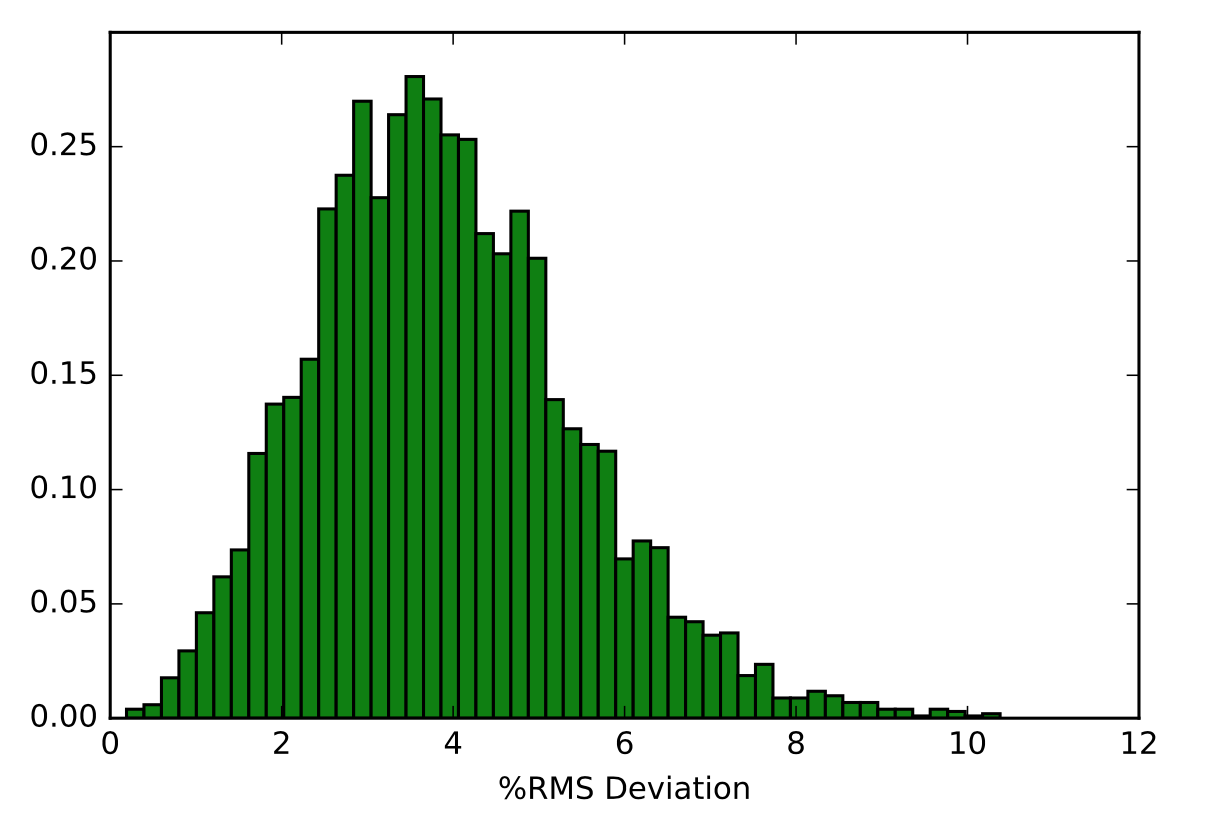
The next visual is a histogram of the 5000 RMS Deviation values that were outputted from using this command on the backbone of the Tryptophan in Melittin. The y-axis represents the fraction of RMS Deviation values that made up the data, while the x-axis represents the RMS Deviation values themselves.
Example Usage: rms sample_rms :19@C,CA,N out sample_rms.dat